CapRover

CapRover

  • Docs
  • GitHub
  • Slack Group

›Do More

Basics

  • Getting Started
  • CaptainDuckDuck Upgrade
  • Captain Definition File
  • Deployment Methods
  • App Configuration
  • Persistent Apps
  • CLI Commands
  • One-Click Apps
  • Complete Webapp Tutorial

Do More

  • Resource Monitoring
  • NGINX Config
  • Service Update Override
  • App Scaling & Cluster
  • Pre-deploy Script
  • Play with CapRover
  • Run Locally
  • Certbot Overrides
  • Custom Themes

Recipes and Tips

  • Sample Apps
  • Zero Downtime
  • Database Connection
  • Best Practices
  • Backup & Restore
  • Static React App
  • Stateless with Persistent data
  • Docker Compose
  • CI/CD Integration

    • Intro
    • Deploy from GitHub
    • Deploy from GitLab

Help

    Server Purchase

    • DigitalOcean
    • OpenStack
  • Disk Clean-Up
  • Firewall & Port Forwarding
  • Troubleshooting
  • Troubleshooting (Pro)
  • Help and Support
Edit

Resource Monitoring


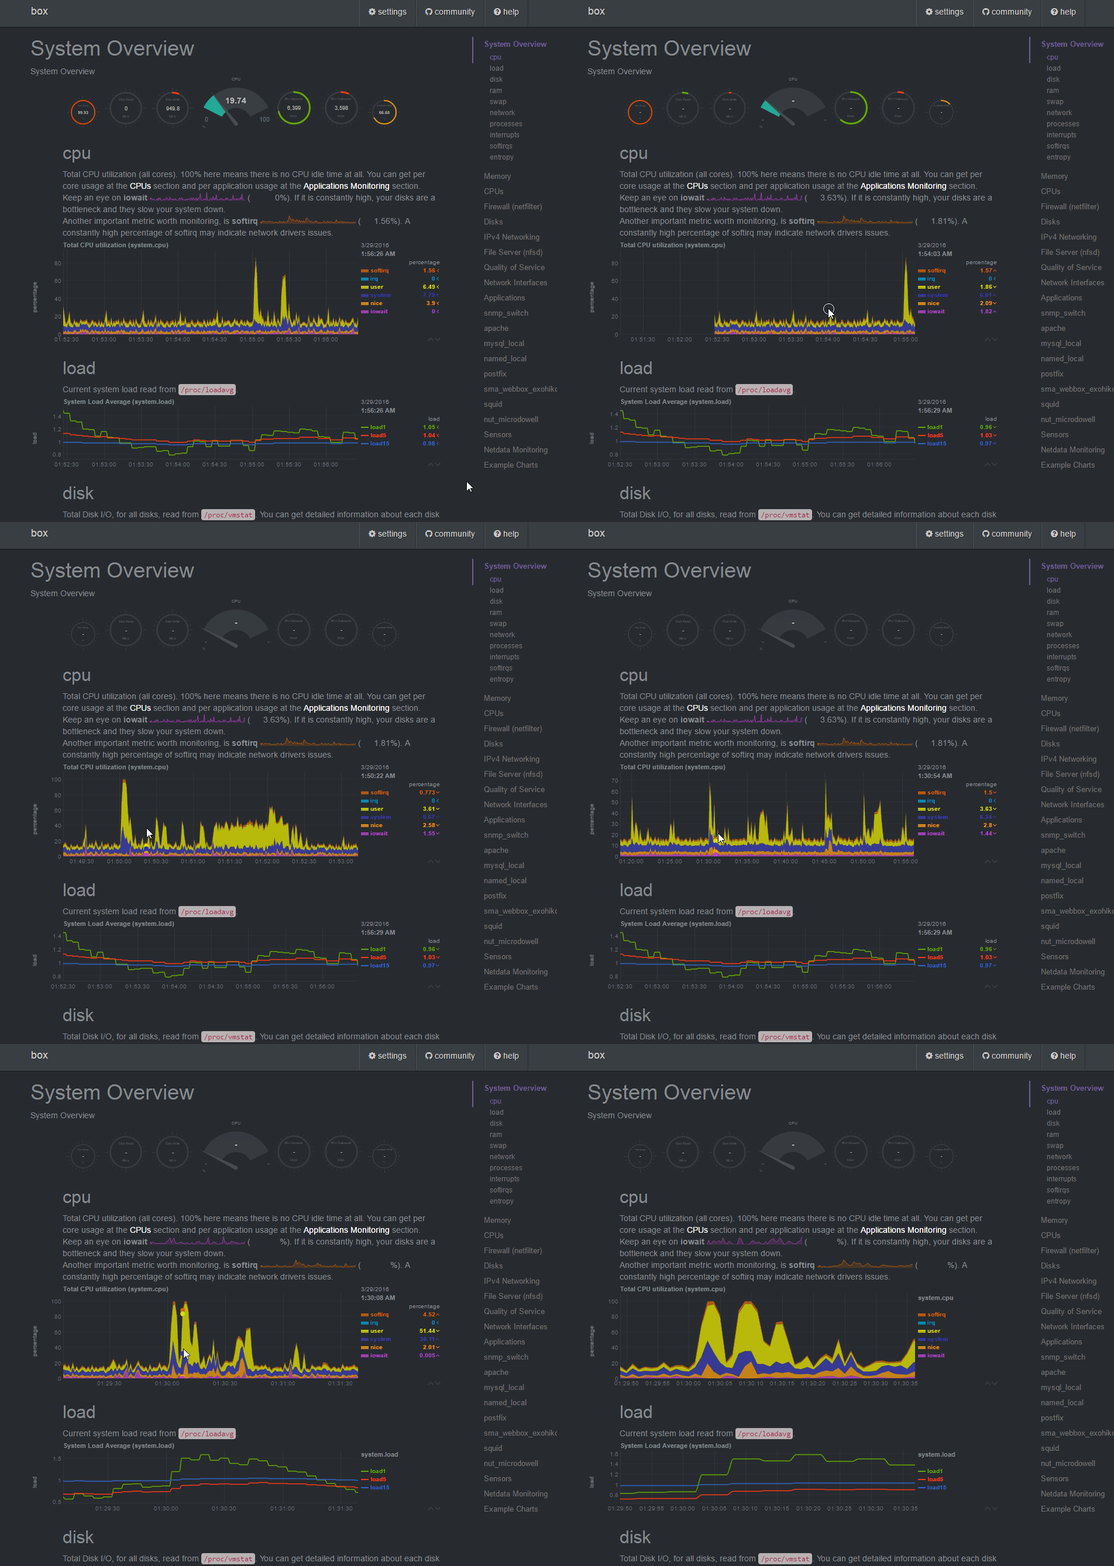
You always want to see how your app is behaving. Is it eating up your memory or CPU? Or is your network connection slow? You can answer all these questions by visiting Captain Monitoring menu from the web dashboard. You can enable NetData which is a server monitoring tool and monitor your server.
← Complete Webapp TutorialNGINX Config →
CapRover
Docs
Getting Started
Community
TwitterSlack Group
More
GitHubStar
Copyright © 2025 githubsaturn